发烧论坛

注册


发新话题 回复该主题

How We Test Amplifiers如何测试放大器 [复制链接]

查看: 6690|回复: 46
21#

darTZeel NHB-108 Model One Stereo

Additional Data

  • Measurements were made with 120V AC line voltage with both channels driven, driving the unbalanced inputs unless otherwise noted.
  • Gain: 20x, 26dB.
  • Output noise, 8-ohm load, unbalanced input, 1k-ohm input termination: wideband 0.602mV, -73.4dBW; A weighted 0.062mV, -93.2dBW.
  • Output noise, 8-ohm load, balanced input, 600-ohm input termination: wideband *6.41mV, -52.9dBW; A weighted 0.088mV, -90.1dBW. (* There was a small amount of approximately 90kHz low-level spurious signal in the left channel that the manufacturer indicates that some units do exhibit and is deemed harmless to the sound.)
  • AC line current draw at idle: 1.3A.
  • Output impedance at 50Hz: 0.29 ohms.
  • This amplifier does not invert polarity.

Measurements Summary

Power output with 1kHz test signal
  • 8-ohm load at 1% THD: 142W

  • 4-ohm load at 1% THD: 158W
General
The darTZeel NHB-108 is a medium-power solid-state design with typically wide bandwidth and output impedance a bit higher than is usual for solid-state amplifiers. Some of its measured characteristics are similar to those of a tube amplifier, such as relatively high measured distortion and a modest damping factor. Both are suggestive of little or no overall negative feedback in the design.
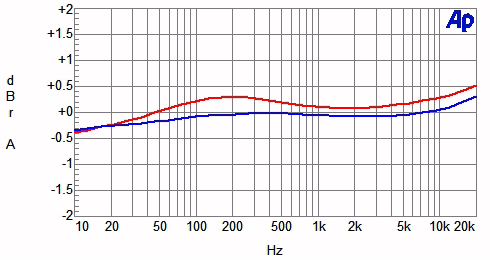
Chart 1 shows the frequency response of the amp with varying loads. As can be seen, the output impedance, as judged by the closeness of spacing between the curves of open circuit, 8-ohm, and 4-ohm loading, is quite low. The variation with the NHT dummy load in the audio range is of the order of +/-0.25 dB.
Chart 2 illustrates how total harmonic distortion plus noise vs. power varies for 1kHz and SMPTE IM test signals and amplifier output load. As can be seen, attainable power is greater for the 4-ohm load, as is usual for most power amplifiers. Amount of distortion is relatively high for solid-state designs, but the way the amp goes into clipping is more like a typical solid-state amplifier.
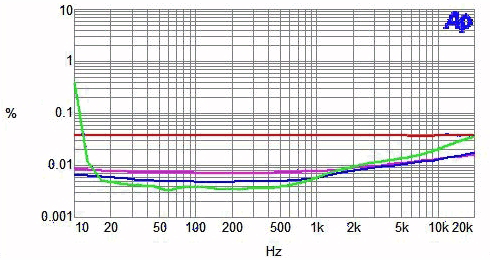
Total harmonic distortion plus noise as a function of frequency at several different power levels is plotted in Chart 3. Interestingly, the distortion amount vs. frequency for the lower powers is virtually constant, whereas at higher powers the distortion does rise a bit at the high end of the audio band.
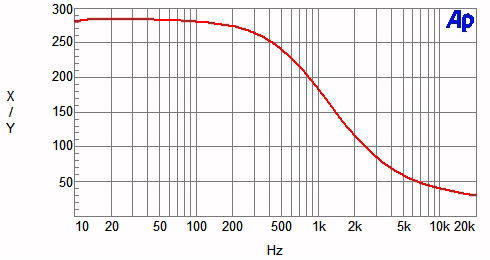
Damping factor vs. frequency is shown in Chart 4, and is moderate but reasonably constant with frequency, again not usual for solid-state designs.
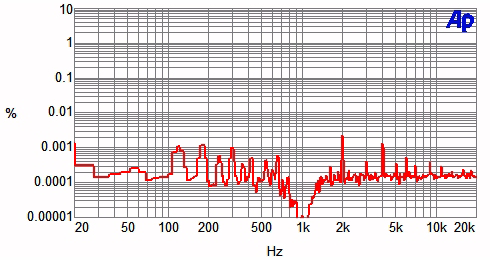
A spectrum of the harmonic distortion and noise residue of a 10W 1kHz test signal is plotted in Chart 5. The magnitude of the AC-line harmonics is quite numerous and intermodulation components of line harmonics with signal harmonics are also just visible near the noise floor. The test signal harmonics are both even and odd and don't decline or tail-off with frequency very fast.

Chart 1 - Frequency Response of Output Voltage as a Function of Output Loading


Red line: open circuit
Magenta line: 8-ohm load
Blue line: 4-ohm load
Cyan line: NHT dummy-speaker load

Chart 2 - Distortion as a Function of Power Output and Output Loading


(line up at 10W to determine lines)
Top line: 4-ohm SMPTE IM
Second line: 8-ohm SMPTE IM
Third line: 4-ohm THD+N
Bottom line: 8-ohm THD+N

Chart 3 - Distortion as a Function of Power Output and Frequency


8-ohm output loading
Cyan line: 100W
Blue line: 40W
Magenta line: 10W
Red line: 1W

Chart 4 - Damping Factor as a Function of Frequency


Damping factor = output impedance divided into 8

Chart 5 - Distortion and Noise Spectrum


1kHz signal at 10W into an 8-ohm load

  • 测量了既与120V交流线路电压驱动渠道,推动非平衡输入,除非另有说明。
  • 增益:20倍,为26dB。
  • 输出噪声,8欧姆负载,不平衡输入,1K的欧姆输入终端:宽带0.602mV,- 73.4dBW,一个加权0.062mV,- 93.2dBW。
  • 输出噪声,8欧姆负载,平衡输入,600欧姆的输入端接:宽带* 6.41mV,- 52.9dBW,一个加权0.088mV,- 90.1dBW。 (*有一个约90kHz低级别的杂散信号少量左声道的制造商表示,一些单位做展出,被认为是无害的声音。)
  • 交流线电流消耗在空闲:1.3a的。
  • 在50Hz输出阻抗:0.29欧姆。
  • 该放大器的极性不能倒置。

测量综述

功率输出1kHz的测试信号
  • 8欧姆负载,1%总谐波失真:142W

  • 4欧姆负载,1%总谐波失真:158W
一般
总健康效益的darTZeel - 108是一种中等功率固体状态与一般宽的带宽和输出阻抗高一点,比固态放大器通常的设计。 其测量的特点有些类似,一个管放大器等相对高的测量失真和适度阻尼因子。 两者都是很少或根本没有整体的设计负反馈暗示。
图1显示了用不同的负载放大器的频率响应。 可以看出,输出阻抗,作为判断之间开路,8欧姆,4欧姆负荷曲线间距接近,是相当低的。 与音频范围内的莱科萨斯假负载的变化,是秩序+ / -0.25分贝。
图2说明了总谐波失真加噪声与功率1kHz的测试信号和SMPTE的IM和放大器的输出负载变化。 可以看出,可实现功率为4欧姆负载更大,因为是常见的,最功率放大器。 变形量相对固态设计的高,但这样的放大器去剪裁成更像是一个典型的固态放大器。
总谐波失真加作为频率的函数噪声功率水平在几个不同的是在图3所示。 有趣的是,主场迎战权力的较低频率的失真量几乎不变,而在更高的权力,扭曲并增加在音频频带高端一点。
阻尼随频率变化的因素是在图4所示,是温和的,但合理的频率不变,又不是固态设计如常。
阿的谐波失真和10W的1kHz的测试信号噪声频谱残留绘制于图5。 将AC -线路谐波幅度相当众多的线路谐波​​和互调分量信号谐波也只是接近本底噪声可见。 测试信号谐波都是偶数和奇数和尾下降或不小康,频率非常快。
TOP
22#

Esoteric A-100 Integrated

Additional Data

  • Measurements were made at 120V AC-line voltage with both channels being driven.
  • Measurements made on left channel and into the "RCA 1" input and on the 8-ohm output unless otherwise noted.
  • This integrated amplifier does not polarity.
  • AC line current draw at idle: 1.96A
  • Input sensitivity for 1W output into 8 ohms, volume at maximum, Lch/Rch: 72.0mV/67.8mV
  • Input impedance @ 1kHz
    • RCA 1 input: 10k ohms
    • XLR input: 20k ohms
    • Direct input: >350k ohms
  • Output impedance at 50Hz: 4.7 ohms
  • Gain, output voltage divided by input voltage, volume at maximum, Lch/Rch: 39.3X, 31.99dB/41.7X, 32.4dB
  • Output noise, 8-ohm load, 1k-ohm input termination, Lch/Rch
    • Volume control at reference position
      • wideband: 0.63mV, -70.0dBW/0.68mV, -72.4 dBW
      • A weighted: 0.30mV, -79.5dBW/0.16mV, -85.0dBW
    • Volume control full clockwise
      • wideband: 0.63mV, -70.0dBW/0.65mV, -72.8dBW
      • A weighted:0.28mV, -80.1dBW/0.20mV, -83.0dBW
    • Volume control full counterclockwise
      • wideband: 0.60mV, -73.5dBW/0.76mV, -71.4dBW
      • A weighted: 0.29mV, -79.8dBW/0.32mV, -78.9dBW

Measurements Summary

Power output with 1kHz test signal
  • 8-ohm load at 1% THD: 9.0W
  • 8-ohm load at 10% THD: 56.0W

  • 4-ohm load at 1% THD: 7.4W
  • 4-ohm load at 10% THD: 66.0W
General
The Esoteric A-100 is a medium-power stereo tube integrated amplifier. A pair of KT88 output tubes per channel provides a modest power output of about 45Wpc. The technology of the circuitry is said to provide automatic tube bias correction under various conditions. For such a technical story of the unit’s sophistication, the measurements of this design are not particularly impressive. It would appear that the amount of overall feedback is low given the high output impedance and consequent low damping factor. One thing of note is that the two-position bias-control switch didn’t seem to make a difference in distortion or AC-power drawn as would be the case if the actual output tube bias were changed as is suggested in the owner’s manual.
As a point of interest, the integrated amplifier sounded extremely refined, dynamic and musically realistic when driving my Genesis Advanced Technologies 6.1 speakers. However, I did have to reduce the bass level of the active woofers somewhat to get a more correct balance due to the rising impedance with decreasing frequency of these speakers.
Chart 1 shows the frequency response of the A-100 with varying loads. The high-frequency response is impressively wide, with an approximate 3dB down point of 80kHz and nicely controlled high-frequency roll-off. However, output impedance as judged by the closeness of spacing between the curves of open-circuit, 8-ohm, and 4-ohm loading is quite high. As a consequence, the NHT dummy-speaker load has a variation of a bit more than +/-2dB. In my opinion, this is too much and will produce audible coloration with many speaker loads. The frequency response was quite independent of volume-control setting. Volume-control tracking was generally within about 0.5dB down to –60dB, where it increased to about 2dB.
Chart 2 illustrates how total harmonic distortion plus noise vs. power varies for 1kHz and SMPTE IM test signals and amplifier output load. Amount of distortion is typical of many tube power amplifiers with low overall amounts of feedback. Interestingly, the 4-ohm loading for the 1kHz test signal produces quite a bit lower distortion up to a few watts and a bit more maximum power at the 10% distortion point.
Total harmonic distortion plus noise as a function of frequency at several different power levels is plotted in Chart 3. The amount of rise in distortion at high frequencies is admirably low. Distortion does rise at low frequencies and relatively more at lower powers. At the 45W output level, distortion rises to greater than 10% below about 200Hz.
Damping factor vs. frequency is shown in Chart 4 and is, as mentioned above, quite low, resulting in poor output regulation with changing load. It is quite uniform over most of the audio range, however.
A spectrum of the harmonic distortion and noise residue of a 10W 1kHz test signal is plotted in Chart 5. The magnitudes of the AC-line harmonics are reasonably low and simple. There is evidence of the line harmonic intermodulation of the 1kHz signal, as seen in quite a few amplifiers. Signal harmonics consist of a tapering-off spectrum of even and odd harmonics.

Chart 1 - Frequency Response of Output Voltage as a Function of Output Loading


Red line: open circuit
Magenta line: 8-ohm load
Blue line: 4-ohm load
Cyan line: NHT dummy speaker load

Chart 2 - Distortion as a Function of Power Output and Output Loading


(line up at 10W to determine lines)
Top line: 4-ohm SMPTE IM
Second line: 8-ohm SMPTE IM
Third line: 4-ohm THD+N
Bottom line: 8-ohm THD+N

Chart 3 - Distortion as a Function of Power Output and Frequency


8-ohm output loading
Cyan line: 45W
Blue line: 30W
Magenta line: 10W
Red line: 1W

Chart 4 - Damping Factor as a Function of Frequency


Damping factor = output impedance divided into 8

Chart 5 - Distortion and Noise Spectrum


1kHz signal at 10W into an 8-ohm load

附加数据

  • 测量是在120伏交流线路与被驱动两个通道的电压。
  • 测量左声道,就进入“RCA的一”输入和8欧姆的输出,除非另有说明。
  • 这种集成放大器并没有极性。
  • 交流线电流消耗在怠速:1.96A
  • 1W输出输入为8欧姆,音量开到最大的灵敏度,廖创兴/ Rch的:72.0​​mV/67.8mV
  • @ 1kHz的输入阻抗
    • RCA的1输入:10K欧姆
    • XLR输入:20,000欧姆
    • 直接输入:> 35万欧姆
  • 在50Hz输出阻抗:4.7欧姆
  • 增益,输出电压由输入电压,在最大音量分,廖创兴/ Rch的:39.3X,31.99dB/41.7X,32.4分贝
  • 输出噪声,8欧姆负载,1K的欧姆输入终端,廖创兴/ Rch的
    • 音量控制在基准位置
      • 宽带:0.63mV,-70.0dBW/0.68mV,-72.4无国界医生组织
      • A加权:0.30mV,-79.5dBW/0.16mV,- 85.0dBW
    • 音量控制旋钮顺时针满
      • 宽带:0.63mV,-70.0dBW/0.65mV,- 72.8dBW
      • A加权:0.28mV,-80.1dBW/0.20mV,- 83.0dBW
    • 音量控制逆时针
      • 宽带:0.60mV,-73.5dBW/0.76mV,- 71.4dBW
      • A加权:0.29mV,-79.8dBW/0.32mV,- 78.9dBW

测量综述

功率输出1kHz的测试信号
  • 8欧姆负载,1%总谐波失真:9.0W
  • 8欧姆负载为10%总谐波失真:56.0W

  • 4欧姆负载,1%总谐波失真:7.4W
  • 4欧姆负载为10%总谐波失真:66.0W
一般
深奥的A - 100是一种中等功率管集成立体声放大器。 每一个通道输出的KT88管对提供约45Wpc适度的功率输出。 该电路技术一起提供了各种条件下自动管偏差修正。 对于这样一个单位的成熟技术的故事,这种设计的测量并不特别令人印象深刻。 这样看来,整体反馈量低鉴于高输出阻抗和随之而来的低阻尼因素。 一个值得注意的是,这两个位置偏差控制开关似乎并没有作出在变形或交流功率差得出的情况下,如果将实际输出管偏见,改变为在车主手册建议。
作为一个兴趣点,集成的放大器听起来非常精致,逼真的动态和驾驶时我的音乐创世纪的先进技术6.1音箱。 不过,我也必须减少低音喇叭低音的活跃程度有所以获得更正确的平衡,由于与这些扬声器的频率降低阻抗上升。
图1显示了不同负荷的A - 100的频率响应。 高频率响应赫然宽,上下近似3dB的点,很好地控制80kHz的高频滚降。 不过,输出阻抗作为判断之间开路,8欧姆,4欧姆加载曲线间距接近相当高。 作为一个结果,莱科萨斯虚拟扬声器负载有一点超过+ / - 2dB的变化。 在我看来,这是太多,会产生许多扬声器负载声染色。 频率的反应相当的音量控制设置无关。音量控制跟踪,一般在大约0.5分贝低至-60分贝,它增加至约2dB。
图2说明了总谐波失真加噪声与功率1kHz的测试信号和SMPTE的IM和放大器的输出负载变化。 变形量是由许多小管与总金额的反馈功率放大器的典型。 有趣的是,在1kHz的测试信号4欧姆负荷产生相当多的低失真高达数瓦,在10%失真点多一点的最大功率。
总谐波失真加作为频率的函数噪声功率水平在几个不同的是在图3所示。 在高频率的增加量是令人钦佩的失真低。 在低失真并增加频率较低的权力和相对较多。 在45瓦的输出电平,失真上升到高于10%低于约200Hz时。
阻尼随频率变化的因素是在图4所示是,如上所述,相当低,贫困导致输出调节变载。 这是很均匀的音频范围以上的多数,但是。
阿的谐波失真和10W的1kHz的测试信号噪声频谱残留绘制于图5。 在交流线路谐波的幅度相当低税率和简单。 目前该行的1kHz的谐波互调信号,在不少放大器看到的证据。 信号谐波组成的偶数和奇数谐波逐渐减少过谱。
TOP
23#

Grommes 360 Mono

Additional Data

  • Measurements were made with 120V AC line voltage and one channel driven (this is a mono amplifier). Data shown for the unbalanced input unless otherwise noted.
  • Input impedance
    • Unbalanced: 9.8k ohms.
    • Balanced: 14.1k ohms.
  • Gain
    • Pentode: 49x, 33.8dB.
    • Ultralinear: 30.5x, 29.7dB.
  • Output noise, 8-ohm load, unbalanced input, 1k-ohm input termination
    • Pentode: wideband 1.3mV, -66.7dBW; A weighted 0.26mV, -80.7dBW.
    • Ultralinear: wideband 0.81mV, -70.9dBW; A weighted 0.12mV, -87.4dBW.
  • Output noise, 8-ohm load, balanced input, 600-ohm input termination
    • Pentode: wideband 1.0mV, -69.0dBW; A weighted 0.21mV, -82.6dBW.
    • Ultralinear: wideband 0.82mV, -70.7dBW; A weighted 0.17mV, -84.4dBW.
  • AC line current draw at idle: 1.45A.
  • Output impedance at 50Hz
    • Pentode: 17.3 ohms.
    • Ultralinear: 8.5 ohms.
  • This amplifier does not invert polarity.

Measurements Summary

Power output with 1kHz test signal
  • 8-ohm load at 1% THD (P): 14W
  • 8-ohm load at 1% THD (UL): 12W
  • 8-ohm load at 10% THD (P): 77W
  • 8-ohm load at 10% THD (UL): 75W

  • 4-ohm load at 1% THD (P): 6.3W
  • 4-ohm load at 1% THD (UL): 7.5W
  • 4-ohm load at 10% THD (P): 88W
  • 4-ohm load at 10% THD (UL): 75W
General
The Grommes 360 is a medium-power, mono, push-pull tube power amplifier utilizing one pair of KT88 output tubes. Not usual in this day and age is the use of two tube high-voltage rectifiers and a 6L6 tube used presumably as a voltage regulator for either output-tube screen grid voltage or front-end-tube supply voltage.
Distortion behavior of the amp was essentially the same for balanced or unbalanced inputs. One thing that is a bit puzzling is the low input impedance. This parameter, for tube circuits, can easily be much higher than this and is typically 50k ohms or higher for most tube-amp designs. The low input impedance of this amp could penalize the performance of some otherwise very good tube preamps used to drive it.
Chart 1 shows the frequency response of the amp with varying loads for pentode and ultralinear modes. The output impedance, as judged by the closeness of spacing between the curves of open-circuit, 8-ohm, and 4-ohm loading in the pentode mode, is unusually high and would cause major aberrations in the frequency response of many loudspeakers. For instance, with the NHT dummy speaker load, the variation is some +/-5dB. In ultralinear mode, things are a bit better, but still the output impedance, in my opinion, is unacceptably high. All of this technical logic aside, it may well be that this amp with some speakers may be complementary to each other and sound very good.
Chart 2 illustrates how total harmonic distortion plus noise vs. power varies for a 1kHz and SMPTE IM test signals and amplifier output load for both pentode and ultralinear modes. This design, with its single output connection for speaker loads, is about equally good for either 4- or 8-ohm loads in either pentode or ultralinear modes although, as usual, distortion is higher for the 4-ohm loading.
Total harmonic distortion plus noise as a function of frequency at several different power levels is plotted in Chart 3 for both output-stage modes. Amount of rise in distortion at low frequencies is quite pronounced, but it is not atypical for many tube power amps. High-frequency-distortion rise is moderate and reasonably good.
Damping factor vs. frequency is shown in Chart 4. Here, we can see the unusually low damping factor in pentode mode and the approaching acceptable and typical value for some tube amps in ultralinear mode.
A spectrum of the harmonic distortion and noise residue of a 10W 1kHz test signal is plotted in Chart 5 for the ultralinear mode. The pentode-mode signal spectrum was very similar, but had more hum components. The principal signal harmonics are second and third with the remaining harmonics about 20dB below the level of the second and third harmonics. However, there are some spurious non-harmonic-related components present in both modes.

Chart 1 - Frequency Response of Output Voltage as a Function of Output Loading

Pentode

Red line: open circuit
Magenta line: 8-ohm load
Blue line: 4-ohm load
Cyan line = NHT dummy-speaker load

Ultralinear

Red line: open circuit
Magenta line: 8-ohm load
Blue line: 4-ohm load
Cyan line = NHT dummy-speaker load

Chart 2 - Distortion as a Function of Power Output and Output Loading

Pentode

(line up at 1W to determine lines)
Top line: 4-ohm SMPTE IM
Second line: 8-ohm SMPTE IM
Third line: 4-ohm THD+N
Bottom line: 8-ohm THD+N

Ultralinear

(line up at 20W to determine lines)
Top line: 4-ohm SMPTE IM
Second line: 8-ohm SMPTE IM
Third line: 4-ohm THD+N
Bottom line: 8-ohm THD+N

Chart 3 - Distortion as a Function of Power Output and Frequency

Pentode

8-ohm output loading
Cyan line: 60W
Blue line: 30W
Magenta line: 10W
Red line: 1W

Ultralinear

8-ohm output loading
Cyan line: 60W
Blue line: 30W
Magenta line: 10W
Red line: 1W

Chart 4 - Damping Factor as a Function of Frequency


Damping factor = output impedance divided into 8
Magenta line: Ultralinear
Red line: Pentode

Chart 5 - Distortion and Noise Spectrum

Ultralinear

1kHz signal at 10W into an 8-ohm load

附加数据

  • 测量是用120V交流线路电压和一个通道驱动(这是一个单声道放大器)。 显示的数据输入的不平衡,除非另有说明。
  • 输入阻抗
    • 不平衡:9.8k欧姆。
    • 平衡:14.1k欧姆。
  • 增益
    • 五极管:49x,33.8分贝。
    • 超线性:30.5x,二十九点七分贝。
  • 输出噪声,8欧姆负载,不平衡输入,1K的欧姆的输入端接
    • 五极管:宽带1.3mV,- 66.7dBW,一个加权0.26mV,- 80.7dBW。
    • 超线性:宽带0.81mV,- 70.9dBW,一个加权0.12mV,- 87.4dBW。
  • 输出噪声,8欧姆负载,平衡输入,600欧姆的输入端接
    • 五极管:宽带1.0mV,- 69.0dBW,一个加权0.21mV,- 82.6dBW。
    • 超线性:宽带0.82mV,- 70.7dBW,一个加权0.17mV,- 84.4dBW。
  • 交流线电流消耗在空闲:1.45A。
  • 在50Hz输出阻抗
    • 五极管:17.3欧姆。
    • 超线性:8.5欧姆。
  • 该放大器的极性不能倒置。

测量综述

功率输出1kHz的测试信号
  • 8欧姆负载1%总谐波失真(P)的:14W的
  • 8欧姆负载1%总谐波失真(UL认证):12瓦
  • 8欧姆负载为10%总谐波失真(P)的:77W
  • 8欧姆负载为10%总谐波失真(UL认证):75瓦

  • 4欧姆负载1%总谐波失真(P)的:6.3W
  • 4欧姆负载1%总谐波失真(UL认证):7.5W
  • 4欧姆负载为10%总谐波失真(P)的:88W
  • 4欧姆负载为10%总谐波失真(UL认证):75瓦
一般
该Grommes 360是中等功率,单声道,推挽功放管采用一对输出管的KT88。 在这一天不和年龄通常是两个管高压整流器和一6L6管使用或用作输出管帘栅极电压或前端管稳压电源电压大概。
失真放大器行为本质上是平衡或不平衡输入相同。 有一件事情是有点令人费解的是低的输入阻抗。 此参数,为管电路,可以很容易地比这更高的,通常超过50K欧姆全部或大部分管放大器设计高。 这种放大器的输入阻抗可以低一些,否则惩罚非常好的管采用前置放大器来驱动它的性能。
图1显示了不同的五极管和超线性模式荷载作用下的放大器的频率响应。 输出阻抗,如之间开路,8欧姆,并在五极管模式4欧姆负荷曲线间距接近判断,是不寻常的高,并会引起许多扬声器频率响应的主要像差。 举例来说,随着莱科萨斯虚拟扬声器负载,变异是一些+ / - 5dB的。 在超线性模式,情况好一点,但仍是输出阻抗,在我看来,是令人无法接受。 这一技术逻辑都放在一边,它很可能是这与一些发言者放可能是互补,彼此的声音非常好。
图2说明了总谐波失真加噪声与电源一个1kHz和SMPTE即时测试信号和为五极管和超线性放大器的输出负载变化模式。 这与它的扬声器负载单输出接口设计,大约是同样对于任何美好4 - 或8欧姆的负载,或者虽然不是五极管,像往常一样,失真度为4欧姆负荷较高的超线性模式。
总谐波失真加作为频率的函数噪声功率水平在几个不同的是在图3所示为输出级模式。 在低频失真量上升是相当显着,但不是很多非典型功放管。 高频失真上涨温和,相当不错。
阻尼随频率变化的因素是列于图4。 在这里,我们可以看到在五极管模式不同寻常的低阻尼因素,接近可以接受的,典型的超线性模式中的一些管放大器的价值。
阿的谐波失真和10W的1kHz的测试信号噪声残留在频谱图5绘制的超线性模式。 在五极管模式的信号频谱是非常相似,但有更多的嗡嗡声元件。 主要信号谐波第二和第三位,约低于第二和第三级谐波20dB的剩余谐波。 不过,也有一些虚假的非谐波相关的组件在这两种模式存在。
TOP
24#

Krell FPB-300c Stereo

Additional Data

  • Measurements were made with 120V AC line voltage.
  • Power output plotted with both channels driven.
  • Gain: 20.9x, 26.4dB.
  • Output noise, 8-ohm load: wideband 0.227mV, -80.0 dBW; A weighted 0.054mV, -92.5 dBW.
  • AC line current draw at idle: 4.7A, 3.3A when driven hard and hot.
  • Output impedance: 0.069 ohms.
  • This amplifier does not invert polarity.

Measurements Summary

Power output with 1kHz test signal
  • 8-ohm load at 1% THD: 470W
  • 8-ohm load at 10% THD: 520W

  • 4-ohm load at 1% THD: 800W
  • 4-ohm load at 10% THD: 950W
General
The Krell FBP-300c has a wide bandwidth of over 200kHz. Its output impedance is typical of many solid-state power amplifiers and, consequently, the difference between open circuit and 4-ohm loading is quite small. This can be seen in Chart 1. This means that the frequency response into a speaker load will be quite invariant with frequency. This design has what is termed by Krell as "Sustained Plateau Bias II," with the consequence that the amount of output stage current is increased in several steps as the signal level increases. In Chart 2 this has the effect of changing the amount of distortion as these transitions occur. Chart 2 also shows that the rated power of 300W into 8 ohms and 600W into 4 ohms is easily met before clipping occurs (where the distortion rises abruptly). Chart 3 illustrates the desirable characteristic of a low amount of rise in distortion as frequency increases. The low output impedance translates in to a high damping factor as seen in Chart 4. In Chart 5, the harmonic structure for the 10W signal is desirably simple in nature with no harmonics rising above the noise level above the 5th harmonic.

Chart 1 - Frequency Response of Output Voltage as a Function of Output Loading


Red line: open circuit
Magenta line: 8-ohm load
Blue line: 4-ohm load

Chart 2 - Distortion as a Function of Power Output and Output Loading


(line up at 1W to determine lines)
Top line: 4-ohm THD+N
Second line: 8-ohm THD+N
Bottom line (red): 8-ohm SMPTE IM

Chart 3 - Distortion as a Function of Power Output and Frequency


4-ohm output loading
Cyan line: 600W
Blue line: 100W
Magenta line: 10W
Red line: 1W

Chart 4 - Damping Factor as a Function of Frequency


Damping factor = output impedance divided into 8

Chart 5 - Distortion and Noise Spectrum


1kHz signal at 10W into a 4-ohm load

附加数据

  • 测量是用120V交流电压。
  • 输出功率驱动的策划既渠道。
  • 增益:20.9x,二十六点四分贝。
  • 输出噪声,8欧姆负载:宽带0.227mV,-80.0无国界医生组织,一个加权0.054mV,-92.5无国界医生组织。
  • 交流线电流消耗在空闲:4.7A,3.3a按驱动时硬又热。
  • 输出阻抗:0.069欧姆。
  • 该放大器的极性不能倒置。

测量综述

功率输出1kHz的测试信号
  • 8欧姆负载,1%总谐波失真:470W
  • 8欧姆负载为10%总谐波失真:已完成520W

  • 4欧姆负载,1%总谐波失真:800W的
  • 4欧姆负载为10%总谐波失真:950W
一般
该克雷尔投影- 300C的已超过200kHz的宽的带宽。 它的输出阻抗是许多固态功率放大器的典型,因此,两者开路和4欧姆负荷的差异是相当小的。 这可以看出,在图1。 这意味着到扬声器负载频率响应将是相当具有频率不变。 这样的设计有什么作为克雷尔被称为“持续高原偏差二,”随着该阶段的输出电流值是作为信号水平的提高增加了几个步骤的结果。 在图2这有改变的失真量的影响,因为这些转换发生。 图2还显示,300瓦到8欧姆和600W额定功率为4欧姆是很容易满足削波前发生(如失真崛起)。 图3说明了随着频率的增加,在低失真量上升可取的特点。 低到高输出阻抗转换为阻尼因子出现在图4。 图表5,为10W的信号的谐波结构简单,刻意在本质上没有谐波5次谐波以上的噪音水平不断提高。
TOP
25#

Linn Klimax Twin Stereo

Additional Data

  • Measurements were made with 120V AC line voltage.
  • Power output and distortion plotted with both channels driven.
  • Test signal applied to unbalanced inputs unless otherwise noted.
  • Gain: 27.1x, 28.7dB.
  • Output noise, 8-ohm load, unbalanced input, 1k-ohm input termination: wideband 0.348mV, -78.2dBW; A weighted 0.056mV, -94.1dBW.
  • Output noise, 8-ohm load, balanced input, 600-ohm input termination: wideband 0.220mV, -82.2dBW; A weighted 0.035mV, -98.2dBW.
  • AC line current draw at idle: 0.67A; AC line current draw in standby: 0.27A.
  • Output impedance at 50Hz: 0.08 ohms.
  • This amplifier does not invert polarity.

Measurements Summary

Power output with 1kHz test signal
  • 8-ohm load at 1% THD: 118W

  • 4-ohm load at 1% THD: 212W
General
The Linn Klimax 500 Twin design utilizes a switching power supply, and hence allows for the attractive compact form it takes. It appears that Linn has done their homework regarding shielding and managing the potential radiation and corruption from the power-supply switching action. Although I could see some switching noise in the low-power distortion readings, it was way down there in the neighborhood of the 1mV level.
Measurements shown were made through the unbalanced inputs. Most results were essentially the same through the balanced inputs with the exception of the output noise, which was lower using the balanced inputs as the balanced gain is about 6dB lower than the unbalanced input gain. Chart 1 shows the frequency response of the amp with varying loads from an open circuit down to a 4-ohm value. This amp's output impedance is low enough to not bother with plotting the NHT dummy-speaker-load response as the variation would be only of the order of +/- 0.1dB. Chart 2 illustrates how total harmonic distortion plus noise versus power varies for 1kHz and SMPTE IM test signals and amplifier output load. As can be seen, attainable power is greater for the 4-ohm load as is usual for most power amplifiers. Total harmonic distortion plus noise as a function of frequency at several different power levels is plotted in Chart 3. In this plot, the 1W level is dominated by switching noise, which is within the 80kHz measurement bandwidth used for the chart. Damping factor versus frequency is shown in Chart 4. A spectrum of the harmonic distortion and noise residue for a 1kHz test-signal frequency, 10W output level, and 4-ohm loading is plotted in Chart 5. The amount of AC line harmonics are admirably low and there is no hum modulation of some of the signal harmonics as have been seen in quite a few other amplifiers measured.

Chart 1 - Frequency Response of Output Voltage as a Function of Output Loading


Magenta line: open circuit
Red line: 8-ohm load
Blue line: 4-ohm load

Chart 2 - Distortion as a Function of Power Output and Output Loading


(line up at 10W to determine lines)
Top line: 4-ohm SMPTE IM
Second line: 8-ohm SMPTE IM
Third line: 4-ohm THD+N
Bottom line: 8-ohm THD+N

Chart 3 - Distortion as a Function of Power Output and Frequency


8-ohm output loading
Green line: 1W
Cyan line: 10W
Blue line: 30W
Red line: 100W

Chart 4 - Damping Factor as a Function of Frequency


Damping factor = output impedance divided into 8

Chart 5 - Distortion and Noise Spectrum


1kHz signal at 10W into an 4-ohm load

附加数据

  • 测量是用120V交流电压。
  • 输出功率和失真策划既带动渠道。
  • 测试信号施加到非平衡输入,除非另有说明。
  • 增益:27.1x,二十八点七分贝。
  • 输出噪声,8欧姆负载,不平衡输入,1K的欧姆输入终端:宽带0.348mV,- 78.2dBW,一个加权0.056mV,- 94.1dBW。
  • 输出噪声,8欧姆负载,平衡输入,600欧姆的输入端接:宽带0.220mV,- 82.2dBW,一个加权0.035mV,- 98.2dBW。
  • 交流线电流消耗,在闲置:0.67A;交流线电流消耗在待机时:0.27A。
  • 在50Hz输出阻抗:0.08欧姆。
  • 该放大器的极性不能倒置。

测量综述

功率输出1kHz的测试信号
  • 8欧姆负载,1%总谐波失真:118W

  • 4欧姆负载,1%总谐波失真:212W
一般
在林恩Klimax 500双床设计采用了开关电源,从而为有吸引力的紧凑形式需要允许。 看来,林恩已经做好功课和管理方面的潜力屏蔽辐射和功率开关电源的腐败行为。 虽然我可以看到在低功耗读数失真一些开关噪声,这是那里的方式在1mV的水平附近。
测量显示是通过非平衡输入制成。 大部分结果基本上是相同的通过与输出噪声,这是降低使用平衡输入,平衡增益约为6dB的输入增益比不平衡异常低的平衡输入。 图1显示了不同的开路下,从一到4欧姆值荷载作用下的放大器的频率响应。 这种放大器的输出阻抗足够低,不费心策划莱科萨斯虚拟扬声器负载响应的变化将是唯一的秩序+ / - 0.1dB的。 图2说明了总谐波失真加噪声功率比和SMPTE即时1kHz的测试信号和放大器的输出负载变化。可以看出,可实现功率为4欧姆负载的是常见的,最功率放大器更大。 总谐波失真加作为频率的函数噪声功率水平在几个不同的是在图3所示。 在这个小区,1W的水平主要由开关噪声,在80kHz的范围内测量的图表中使用的带宽。 阻尼频率因子与图4所示。 阿的谐波失真和一个1kHz测试信号的频率,10W的输出电平,4欧姆载荷谱噪声残留绘制于图5。 交流线路的谐波量低,是令人钦佩的是没有为已经在相当一个测量放大器看到了一些其他一些嗡嗡声信号谐波调制。
TOP
26#

Luxman B-1000F Mono

dditional Data

  • Measurements were made at 120V AC line voltage and using the balanced inputs unless otherwise noted.
  • Input/output polarity:
    • Unbalanced inputs: non-inverting
    • Balanced inputs: switchable; default is inverting (relative to pin 2 hot)
  • AC line current draw at idle: 3.2A
  • Input impedance @ 1kHz:
    • Unbalanced input: 52.5k ohms
    • Balanced input: 40.0k ohms
  • Output impedance at 50Hz: 0.0039 ohms
  • Input sensitivity for 1W output into 8 ohms:
    • Unbalanced input: 64.3mV
    • Balanced input: 64.7mV
  • Gain, output voltage divided by input voltage:
    • Unbalanced input: 44.0X, 32.8dB
    • Balanced input: 43.7X, 32.8dB
  • Output noise, 8-ohm load, unbalanced input, 1k-ohm input termination:
    • Wideband: 0.28mV, -80.1dBW
    • A weighted: 0.071mV, -92.0dBW
  • Output noise, 8-ohm load, balanced input, 600-ohm input termination:
    • Wideband: 0.96mV, -69.3dBW
    • A weighted: 0.29mV, -79.8dBW

Measurements Summary

Power output with 1kHz test signal
  • 8-ohm load at 1% THD: 312W
  • 8-ohm load at 10% THD: 427W

  • 4-ohm load at 1% THD: 632W
  • 4-ohm load at 10% THD: 844W
General
The Luxman B-1000f is a high-power solid-state mono power amplifier and the flagship of the Luxman line.
Chart 1 shows the frequency response of the amp with varying loads. The high-frequency response is moderately wide with an approximate -3dB point of about 90kHz. Output impedance, as judged by the closeness of spacing between the curves of open-circuit, 8-ohm, and 4-ohm loading, is very low in the audio band and beyond. The usual NHT dummy-load curve is not shown, as the variations in the response would not show.
Chart 2 illustrates how total harmonic distortion plus noise vs. power varies for 1kHz and SMPTE IM test signals and amplifier output load. Amount of distortion is low right up to clipping -- the behavior of most solid-state power amplifiers. This particular design has an enormous power supply and super-beefy output stage and is said to put out 2kW into 1-ohm loads. I have no doubt that it can.
Total harmonic distortion plus noise as a function of frequency at several different power levels is plotted in Chart 3 for 4-ohm loading. As is usual for all but a very few amplifiers, the distortion does rise at high frequencies, above around 500Hz.
Damping factor vs. frequency is shown in Chart 4 and is of a very high value at low frequencies and typical of many solid-state amplifiers, being high at low frequencies and rolling off with increasing frequency starting at some 200Hz. Still, for this amplifier, the damping factor is greater than 100 at 20kHz.
The spectrum of AC-line and test signal-harmonics shown in Chart 5 for a 10W 1kHz test signal into 4 ohms has low amounts of AC-line harmonics. Signal harmonics of second, third, fourth, and fifth order are visible at very low magnitudes, the second being the highest at only 0.001%.

Chart 1 - Frequency Response of Output Voltage as a Function of Output Loading


Red line: open circuit
Magenta line: 8-ohm load
Blue line: 4-ohm load

Chart 2 - Distortion as a Function of Power Output and Output Loading


(line up at 70W to determine lines)
Top line: 4-ohm SMPTE IM
Second line: 4-ohm THD+N
Third line: 8-ohm THD+N
Bottom line: 8-ohm SMPTE IM

Chart 3 - Distortion as a Function of Power Output and Frequency


4-ohm output loading
Green line: 500W
Cyan line: 200W
Blue line: 70W
Magenta line: 10W
Red line: 1W

Chart 4 - Damping Factor as a Function of Frequency


Damping factor = output impedance divided into 8

Chart 5 - Distortion and Noise Spectrum


1kHz signal at 10W into a 4-ohm load

  • 测量是在120V交流电压和使用平衡输入,除非另有说明。
  • 输入/输出极性:
    • 非平衡输入:非反相
    • 平衡输入:切换,默认是反相(相对于针脚2热)
  • 交流线电流消耗在怠速:性别Age and sex
  • @ 1kHz的输入阻抗:
    • 不平衡输入:52.5k欧姆
    • 平衡输入:40.0k欧姆
  • 在50Hz输出阻抗:0.0039欧姆
  • 1W的输入灵敏度为8欧姆的输出:
    • 不平衡输入:64.3mV
    • 平衡输入:64.7mV
  • 增益,输出电压输入电压分为:
    • 非平衡输入:44.0X,三十二点八分贝
    • 平衡输入:43.7X,三十二点八分贝
  • 输出噪声,8欧姆负载,不平衡输入,1K的欧姆的输入端接:
    • 宽带:0.28mV,- 80.1dBW
    • A加权:0.071mV,- 92.0dBW
  • 输出噪声,8欧姆负载,平衡输入,600欧姆的输入端接:
    • 宽带:0.96mV,- 69.3dBW
    • A加权:0.29mV,- 79.8dBW

测量综述

功率输出1kHz的测试信号
  • 8欧姆负载,1%总谐波失真:312W
  • 8欧姆负载为10%总谐波失真:427W

  • 4欧姆负载,1%总谐波失真:632W
  • 4欧姆负载为10%总谐波失真:844W
一般
该Luxman的B - 1000f是一种高功率固体单声道功率放大器和Luxman线的旗舰。
图1显示了用不同的负载放大器的频率响应。 高频率响应适中,约90kHz近似的- 3dB点宽。 输出阻抗,如之间开路,8欧姆,4欧姆负荷曲线间距接近判断,是非常低的音频带和超越。 通常莱科萨斯假负载曲线没有显示出来,如响应的变化将不会显示。
图2说明了总谐波失真加噪声与功率1kHz的测试信号和SMPTE的IM和放大器的输出负载变化。 低失真的数额直到剪辑 - 大多数固态功率放大器的行为。 这种特殊的设计有一个巨大的电源和超结实的输出阶段,并表示将出到1欧姆负载的2kW。 我毫不怀疑,它可以。
总谐波失真加作为频率的函数噪声功率水平在几个不同的是在图3所示为4欧姆负载。 正如一切照旧,所有除了极少数放大器,失真并增加在高频率高于500Hz的周围。
阻尼随频率变化的因素是显示在图4和第一个在低频率非常高的价值,以及许多固态放大器的典型,是在高频率和低频率的增加滚动一些200Hz时出发。 然而,对于这个放大器,阻尼因子大于100在20kHz的。
在交流线和测试信号谐波频谱图5所示为1kHz时为4欧姆,10W的测试信号有交流线路的谐波含量很低。 第二,第三,第四和五阶谐波信号在非常低的程度可见,第二个是在只有0.001%的最高水平。
TOP
27#

Luxman L-509u Integrated

  • Measurements were made at 120V AC line voltage with both channels being driven.
  • Measurements were made on the left channel on the unbalanced inputs in the "line-straight" mode unless otherwise noted.
  • Input/output polarity
    • Unbalanced inputs: non-inverting
    • Balanced inputs: inverting
      (note: balanced inputs do invert polarity in the "normal" position of the balanced input phase switch as Luxman has defined pin 3 "hot" for their balanced inputs. This is easily changed by pressing the switch to "reverse.")
    • Phono inputs: non-inverting
  • AC line current draw at idle: 1.1A
  • Input sensitivity for 1W output into 8 ohms, volume at maximum, Lch/Rch
    • Unbalanced inputs: 17.3mV / 17.3mV
    • Balanced inputs: 17.5mV / 17.6mV
  • Input impedance @ 1kHz
    • Unbalanced inputs: 51k ohms
    • Balanced inputs: 65k ohms
    • Phono MM inputs: 46k ohms
    • Phono MC inputs: 100 ohms
  • Output impedance at 50Hz: 0.027 ohm
  • Gain, output voltage divided by input voltage, volume at maximum, Lch/Rch
    • Unbalanced inputs: 163.6X, 44.3dB / 163.2X, 44.3dB
    • Balanced inputs: 161.3X, 44.2 dB / 161.1X, 44.1dB
  • Phono gain, at 1kHz to tape out
    • MM: 59.8X, 35.5dB
    • MC: 550.0X, 54.8dB
  • Phono overload, input voltage at 1kHz at onset of visual distortion
    • MM: 165.0mV
    • MC: 21.6mV
  • Output noise, unbalanced inputs, 8-ohm load, 1k-ohm input termination, Lch/Rch
    • Volume control at reference position
      • wideband: 2.1mV, -62.6dBW / 2.1mV, -73.9dBW
      • A weighted: 0.30mV, -79.5dBW / 0.28mV, -80.1dBW
    • Volume control full clockwise
      • wideband: 3.8mV, -57.4dBW / 4.0mV, -57.0dBW
      • A weighted: 0.20mV, -83.0dBW / 0.23mV, -81.8dBW
    • Volume control set for 20dB attenuation below reference
      • wideband: 1.7mV, -64.4dBW / 1.7mV, -64.4dBW
      • A weighted: 0.18mV, -84.0 dBW / 0.17mV, -84.4dBW
    • Volume control full counterclockwise
      • wideband: 1.6mV, -65.0dBW / 1.6mV, -65.0dBW
      • A weighted: 0.18 mV, -84.0dBW / 0.16mV, -85.0dBW
  • Output noise, balanced inputs, 8-ohm load, 1k-ohm input termination, Lch/Rch
    • Volume control at reference position
      • wideband: 2.1mV, -62.6dBW / 2.1mV, -62.6dBW
      • A weighted: 0.31mV, -79.2dBW / 0.29mV, -79.8dBW
    • Volume control full clockwise
      • wideband: 3.9mV, -57.2dBW / 3.9mV, -57.2dBW
      • A weighted: 1.1mV, -68.2dBW / 1.1mV, -68.2dBW
    • Volume control set for 20dB attenuation below reference
      • wideband: 1.7mV, -64.4dBW / 1.7mV, -64.4dBW
      • A weighted: 0.20mV, -83.0dBW / 0.17mV, -84.4dBW
    • Volume control full counterclockwise
      • wideband: 1.5mV, -65.5dBW / 1.6mV, -65.0dBW
      • A weighted: 0.17mV, -84.4dBW / 0.15mV, -85.5dBW
  • Phono-referred-equivalent input noise, Lch/Rch
    • MM, input 1k-ohm termination resistance
      • wideband: 5.8uV / 5.6uV
      • A weighted: 0.27uV / 0.28uV
    • MC, input 100-ohm termination resistance
      • wideband: 0.65uV / 0.69uV
      • A weighted: 0.13uV / 0.12uV

Measurements Summary

Power output with 1kHz test signal
  • 8-ohm load at 1% THD: 156.1W
  • 8-ohm load at 10% THD: 247.8W

  • 4-ohm load at 1% THD: 130.8W
  • 4-ohm load at 10% THD: 300.4W
General
A few preliminary points about the measurements. It was found that there was virtually no difference in distortion between the unbalanced and balanced inputs. Therefore, the unbalanced inputs were used for most tests. Also, the performance with the tone and balance controls engaged was about the same as with the Line Straight mode, so the latter was used for testing.
The Luxman L-509u is a medium-power solid-state integrated amplifier. As this unit has a preamplifier line stage within, overall line-input gain of this unit is somewhat high compared to the general current trend in integrated amplifiers, where the gain is generally near power-amplifier-only gain. Still, the gain combination of the L-509u is that of a typical power amplifier -- only gain plus that of a modest-gain line-level preamp -- and that is known to work just fine in practice.
Chart 1 shows the frequency response of the integrated amp with varying loads. This plot was made with the reference volume-control position as set for 0.5V input to produce 5W output into an 8-ohm load. The high-frequency response at the reference setting of the volume control is reasonably wide, having a -3dB point of about 100kHz. Further, the output impedance of the amp is quite low and, therefore, the NHT dummy-load response is not shown, as its variations would not show at the plot's vertical resolution. As is frequently the case, high-frequency response was somewhat a function of volume-control setting, varying from what looks like a higher bandwidth but different response between channels at full volume as shown in Chart 1A, to a more rolled-off response below full volume than in Chart 1, to an almost flat response out to 200kHz at 50dB of attenuation. Bandwidth is widening toward this at -40dB of attenuation, as shown plotted in Chart 1B.
Chart 2 illustrates how total harmonic distortion plus noise vs. power varies for 1kHz and SMPTE IM test signals and amplifier output load. This unit exhibits typical solid-state low-distortion behavior of noise-dominated distortion at low powers, with actual distortion starting to show at powers of about 50W and above.
Total harmonic distortion plus noise as a function of frequency at several different power levels is plotted in Chart 3 for 4-ohm loading. A good result is that the amount of rise in distortion at high frequencies is moderate.
Damping factor vs. frequency is shown in Chart 4 and is of a high value at low frequencies and, as typical of many solid-state power amplifiers, begins to fall off rapidly with frequency at about 500Hz.
A spectrum of the harmonic distortion and noise residue of a 10W 1kHz test signal into 4 ohms is plotted in Chart 5. The magnitudes of the AC-line harmonics are low. Signal harmonics are low, and intermodulation effects of the AC-line harmonics on the signal harmonics are quite absent here.
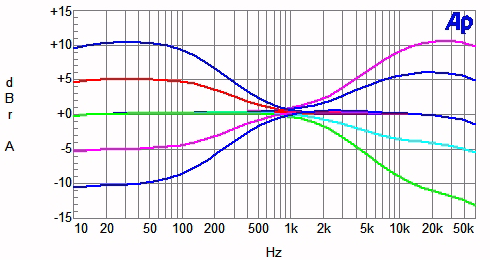
With the Line Straight button disengaged to allow balance and tone-control use, tone-control characteristics were measured and are shown in Chart 6.
Lastly, RIAA equalization error was measured for both MM and MC modes and is shown plotted in Charts 7A and 7B.

Chart 1 - Frequency Response of Output Voltage as a Function of Output Loading

1A
volume control at reference position
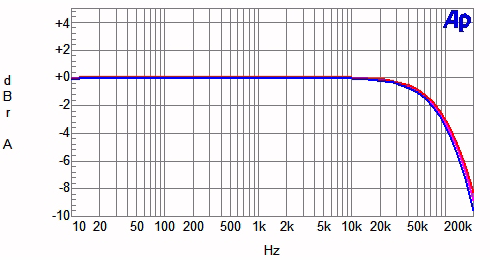
Red line: open circuit
Magenta line: 8-ohm load
Blue line: 4-ohm load

1B
volume control full up, 8-ohm load
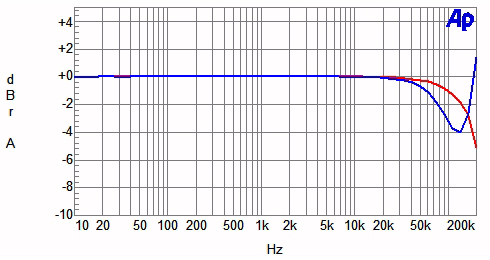
Red line: open circuit
Blue line: 8-ohm load

1C
volume control -20dB below reference position, 8-ohm load

Red line: open circuit
Blue line: 8-ohm load

Chart 2 - Distortion as a Function of Power Output and Output Loading


(line up at 20W to determine lines)
Top line: 4-ohm SMPTE IM
Second line: 4-ohm THD+N
Third line: 8-ohm SMPTE IM
Bottom line: 8-ohm THD+N

Chart 3 - Distortion as a Function of Power Output and Frequency


4-ohm output loading
Green line: 100W
Blue line: 70W
Magenta line: 10W
Red line: 1W

Chart 4 - Damping Factor as a Function of Frequency


Damping factor = output impedance divided into 8

Chart 5 - Distortion and Noise Spectrum


1kHz signal at 10W into a 4-ohm load

Chart 6 - Phono-Stage RIAA Equalization Error

7A
moving magnet (MM)

Red line: left channel
Blue line: right channel

7B
moving coil (MC)
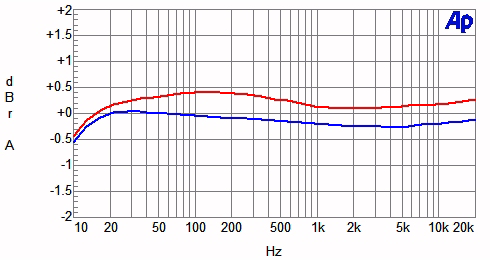
Red line: left channel
Blue line: right channel

Chart 8 - Tone-Control Response


Data below 1kHz
Blue line (top): maximum bass boost
Red line: intermediate bass boost
Green line: flat
Magenta line: intermediate bass cut
Blue line (bottom): maximum bass cut

Data above 1kHz
Magenta line (top): maximum treble boost
Blue line (second from top): intermediate treble boost
Blue line (third from top): flat
Light blue line: intermediate treble cut
Green line: maximum treble cut

  • 测量是在120V交流线路电压均为驱动渠道。
  • 测量是在“行直”模式,除非另有说明就关于非平衡输入左声道。
  • 输入/输出极性
    • 非平衡输入:非反相
    • 平衡输入:反相
      (注:平衡输入做的“正常”的平衡输入相开关的位置作为Luxman确定了3针“热”的平衡式输入,这是很容易被按下开关来改变极性反转。“反向”。)
    • 唱机输入:非反相
  • 交流线电流消耗在怠速:为1.1A
  • 1W输出的输入灵敏度为8欧姆,体积最大,廖创兴/ Rch的
    • 非平衡输入:17.3mV / 17.3mV
    • 平衡式输入:17.5mV / 17.6mV
  • @ 1kHz的输入阻抗
    • 非平衡输入:51k欧姆
    • 平衡输入:65000欧姆
    • MM的唱机输入:46k欧姆
    • 管委会唱机输入:100欧姆
  • 在50Hz输出阻抗:0.027欧姆
  • 增益,输出电压由输入电压,在最大音量分,廖创兴/ Rch的
    • 非平衡输入:163.6X,四十四点三分贝/ 163.2X,四十四点三分贝
    • 平衡输入:161.3X,44.2分贝/ 161.1X,四十四点一分贝
  • 唱机增益,在1kHz到磁带出
    • 莫斯利:59.8X,35.5分贝
    • 主持人:550.0X,五十四点八分贝
  • 唱机过载,输入电压在1kHz发病的视觉失真
    • 莫斯利:165.0mV
    • 司仪:21.6mV
  • 输出噪声,非平衡输入,8欧姆负载,1K的欧姆输入终端,廖创兴/ Rch的
    • 音量控制在基准位置
      • 宽带:2.1mV,- 62.6dBW / 2.1mV,- 73.9dBW
      • A加权:0.30mV,- 79.5dBW / 0.28mV,- 80.1dBW
    • 音量控制旋钮顺时针满
      • 宽带:3.8mV,- 57.4dBW / 4.0mV,- 57.0dBW
      • A加权:0.20mV,- 83.0dBW / 0.23mV,- 81.8dBW
    • 20dB的音量控制设定以下参考衰减
      • 宽带:1.7mV,- 64.4dBW / 1.7mV,- 64.4dBW
      • A加权:0.18mV,-84.0无国界医生组织/ 0.17mV,- 84.4dBW
    • 音量控制逆时针
      • 宽带:1.6mV,- 65.0dBW / 1.6mV,- 65.0dBW
      • A加权:0.18毫伏,- 84.0dBW / 0.16mV,- 85.0dBW
  • 输出噪声,平衡输入,8欧姆负载,1K的欧姆输入终端,廖创兴/ Rch的
    • 音量控制在基准位置
      • 宽带:2.1mV,- 62.6dBW / 2.1mV,- 62.6dBW
      • A加权:0.31mV,- 79.2dBW / 0.29mV,- 79.8dBW
    • 音量控制旋钮顺时针满
      • 宽带:3.9mV,- 57.2dBW / 3.9mV,- 57.2dBW
      • A加权:1.1mV,- 68.2dBW / 1.1mV,- 68.2dBW
    • 20dB的音量控制设定以下参考衰减
      • 宽带:1.7mV,- 64.4dBW / 1.7mV,- 64.4dBW
      • A加权:0.20mV,- 83.0dBW / 0.17mV,- 84.4dBW
    • 音量控制逆时针
      • 宽带:1.5mV,- 65.5dBW / 1.6mV,- 65.0dBW
      • A加权:0.17mV,- 84.4dBW / 0.15mV,- 85.5dBW
  • 唱机,称为等效输入噪声,廖创兴/ Rch的
    • 的MM,输入1k的欧姆的终端电阻
      • 宽带:5.8uV / 5.6uV
      • A加权:0.27uV / 0.28uV
    • 三菱商事,输入100欧姆终端电阻
      • 宽带:0.65uV / 0.69uV
      • A加权:0.13uV / 0.12uV

测量综述

功率输出1kHz的测试信号
  • 8欧姆负载,1%总谐波失真:156.1W
  • 8欧姆负载为10%总谐波失真:247.8W

  • 4欧姆负载,1%总谐波失真:130.8W
  • 4欧姆负载为10%总谐波失真:300.4W
一般
关于一些初步的测量点。 结果发现,大致上没有不平衡之间的差异和平衡输入失真。 因此,不平衡的投入被用于大多数测试。 此外,与平衡的基调和从事有关控制性能作为与行,直模式大致相同,因此后者是用于测试。
在Luxman L型509u是一个中等功率固态放大器集成。 由于本单位的前置线阶段内,总体思路,输入本机的增益是有点高比一般的,目前的趋势,即集成放大器的增益一般是近功率放大器只增益。 尽管如此,在L - 509u增益组合,是一个典型的功率放大器 - 只获得一个温和的加增益线路级放大器 - 这是已知能够在实践中就好了。
图1显示了变载荷集成放大器的频率响应。 此图写了与参考音量控制位​​置为0.5V的输入,以产生为8欧姆负载5W输出设置。 在音量控制设置参考高频率响应范围是合理的,具有的- 3dB点为100kHz左右。 此外,该放大器的输出阻抗非常低,因此,莱科萨斯假负载反应并不显示,因为它的变化不会显示在图的垂直分辨率。 由于经常出现的情况,高频率响应有点的音量控制设置功能,从什么像一个更高的带宽,但不同的反应通道间的最大音量,如在图1a所示的外表,变到更推出过下面的反应全卷图表比1,几乎平坦的响应了在衰减为50dB至200kHz。 带宽是朝这个在-衰减四十○分贝扩大,如绘于图1B所示。
图2说明了总谐波失真加噪声与功率1kHz的测试信号和SMPTE的IM和放大器的输出负载变化。 本单元展示典型的固态低失真行为噪声占主导地位的权力,在低失真,失真的实际出发,以显示在约50瓦及以上的权力。
总谐波失真加作为频率的函数噪声功率水平在几个不同的是在图3所示为4欧姆负载。 一个很好的结果是,在高频率的失真量上升是温和的。
阻尼系数与频率显示在图4和第一个在低频率高值,并为众多的固态功率放大器的典型,开始脱落频率约为500Hz的迅速。
阿的谐波失真和10W的1kHz的测试信号噪声残留为4欧姆谱绘制于图5。 在交流线路谐波的幅度较低。 信号谐波低,对信号的谐波的交流线路谐波互调的影响是相当不存在了。
随着线直按钮脱开,使平衡和音调控制使用,音调控制特性进行了测量,并在图6所示。
最后,美国唱片行业协会,测量误差均衡为MM和MC的模式,并显示在图7A和7B绘制。

以下数据1kHz时
蓝线(上):最大低音增强
红线:中间低音增强
绿线:平
洋红色线条:中间低音切
蓝线(下):最大的低音切

以上数据1kHz时
洋红色线条(上):最大高音增强
蓝线(第二次从上):中间高音增强
蓝线(第三次从上):平
淡蓝色行:中间高音切
绿线:最大高音切


TOP
28#

Manley Laboratories Snapper Mono

  • Measurements were made with 120V AC line voltage.
  • Output tube plate current adjusted to 30mA per tube when warmed up.
  • Power output and distortion plotted with both channels driven.
  • Gain, unbalanced input/balanced input: 36.4x, 31.2dB/19.2x, 25.7dB.
  • Output noise, 8-ohm load, unbalanced input, 1-kohm input termination: wideband 0.6mV, -73.5dBW; A weighted 0.13mV, -86.7dBW.
  • AC line current draw at idle: 1.4A.
  • Output impedance at 50Hz: 1.8 ohms.
  • This amplifier does not invert polarity.

Measurements Summary

Power output with 1kHz test signal
  • 8-ohm load at 1% THD: 60W
  • 8-ohm load at 10% THD: 120W

  • 4-ohm load at 1% THD: 10W
  • 4-ohm load at 10% THD: 150W

  • 16-ohm load at 1% THD: 53W
  • 16-ohm load at 10% THD: 82W
General
This amp is a push-pull design rated at a nominal 100W. Bias is set by convenient test points and adjustable controls on the top part of the chassis. The idling current as received when warmed up was quite uniform between the four output tubes at about 30mA (0.3V across assumed 10-ohm resistors) and was not adjusted for the measurements.
Measurements were made using the unbalanced input. It was found that results with the balanced inputs were virtually the same. Frequency response, as seen in Chart 1, is beautifully controlled in the high-frequency end as a function of load. The low-frequency response holds up down to 10Hz nicely at the 1W level of the test. Output impedance is typical of many tube amplifiers giving an approximate +/-1dB frequency-response variation with the NHT dummy-speaker load. Total Harmonic distortion plus noise as a function of power output and load for a test frequency of 1kHz is plotted in Chart 2. Also shown in this chart is the SMPTE IM distortion for an 8-ohm load. Not having separate 4- and 8-ohm outputs available, this amp is clearly designed for an optimum load lower than 8 ohm, most likely around 6 ohms. This can be seen as the attainable output power is more like 140-150W into 4 ohms. As a result of this, considerably less power is available into 16-ohm loads. Total harmonic distortion plus noise as a function of frequency at several power levels is plotted in Chart 3 for an 8-ohm load. Amount of distortion over the main midrange energy band is less than 1% for power outputs of 30W or less. Admirable is the relatively low amount of distortion increase at the higher frequencies. However, distortion does rise considerably below 20Hz at higher power levels. Still, this is very good performance indicating a good output transformer design (as was the nicely controlled high-frequency response). Damping factor vs. frequency referred to an 8-ohm load is plotted in Chart 4 and is approximately 4.5 over most of the audio range. In the spectral plot of distortion and noise for a 10W 1kHz signal into an 8-ohm load on the 8-ohm output, the signal distortion components are dominated by the second and third harmonics with higher-order harmonics at reduced and decreasing amplitude with frequency. There is quite a bit of hum modulation around the suppressed fundamental 1kHz test frequency.

Chart 1 - Frequency Response of Output Voltage as a Function of Output Loading


Magenta line: open circuit
Red line: 8-ohm load
Blue line: 4-ohm load
Cyan line: NHT dummy-speaker load

Chart 2 - Distortion as a Function of Power Output and Output Loading


(line up at 5W to determine lines)
Top line: 8-ohm SMPTE IM
Second line: 4-ohm THD+N
Third line: 8-ohm THD+N
Bottom line: 16-ohm THD+N

Chart 3 - Distortion as a Function of Power Output and Frequency


8-ohm output loading
Cyan line: 100W
Blue line: 30W
Magenta line: 10W
Red line: 1W

Chart 4 - Damping Factor as a Function of Frequency


Damping factor = output impedance divided into 8

Chart 5 - Distortion and Noise Spectrum


1kHz signal at 10W into an 8-ohm load

附加数据

  • 测量是用120V交流电压。
  • 输出电流调整管板每管时至30mA热身。
  • 输出功率和失真策划既带动渠道。
  • 增益,非平衡输入/平衡输入:36.4x,31.2dB/19.2x,二十五点七分贝。
  • 输出噪声,8欧姆负载,不平衡输入,1千欧姆输入终端:宽带0.6mV,- 73.5dBW,一个加权0.13mV,- 86.7dBW。
  • AC线在空闲电流消耗:1.4A的。
  • 在50Hz输出阻抗:1.8欧姆。
  • 该放大器的极性不能倒置。

测量综述

功率输出1kHz的测试信号
  • 8欧姆负载,1%总谐波失真率:60W
  • 8欧姆负载为10%总谐波失真功率:120W

  • 4欧姆负载,1%总谐波失真:10W的
  • 4欧姆负载为10%总谐波失真功率:150W

  • 16欧姆负载,1%总谐波失真:53W
  • 16欧姆负载为10%总谐波失真:82W
一般
此放大器是推挽设计在100W的额定标称。 偏置方便的检测方法是由点和机箱的顶部可调节控制。 空载电流回暖时,收到了相当约三○毫安四个输出管之间的一致(假定为0.3V跨越10欧姆的电阻),而不是为测量调整。
测量了使用不均衡的投入。 结果发现,随着平衡输入结果大致相同。 频率响应,如图表1所示,是控制在美丽的负载功能作为高频结束。 低频响应容纳到在10Hz的试验1W的水平很好。 输出阻抗是许多管提供一个近似的+ / - 1dB的频率响应与莱科萨斯虚拟扬声器放大器的典型负载的变化。 总谐波失真加一个功能,输出功率为1kHz的测试频率负载噪音绘制于图2。 也将在此图是SMPTE的聊天室为一个8欧姆负载失真。 具有单独的4 - 和8欧姆输出可用,这显然是放大器设计为最佳负载低于8欧姆,6欧姆左右最有可能。 这可以被看作是可以实现的输出功率更象140 - 150W的是为4欧姆。 由于这一结果,大大减少电源的情况下为16欧姆负载。 总谐波失真加作为频率的函数噪声功率水平在几个图3所示为一个8欧姆的负载。 中档以上的主要能源带失真量小于1为30W的功率输出%或更少。 令人钦佩的是在较高的变形频率的增加量相对较低。 然而,不失真功率较高增长水平低于20Hz的很大。不过,这是很好的业绩显示出良好的输出变压器的设计(就像是很好控制的高频率响应)。阻尼系数与频率提到了8欧姆负载于图4策划,大约超过4.5音频范围最。 在失真和噪声为10W的1kHz的信号频谱图上成8欧姆输出8欧姆负载,信号失真成分为主,同时降低,降低幅度与频率高次谐波的二次和三次谐波。 有相当多的周围被抑制的根本1kHz的测试频率的嗡嗡声调制位。
TOP
29#

Manley Laboratories Mahi Mono

Additional Data

  • Measurements were made with 120V AC line voltage and one channel driven (this is a mono amplifier).
  • Gain
    • Ultralinear: 28.9x, 29.5dB.
    • Triode: 52.3x, 34.4dB.
  • Output noise, 8-ohm load, unbalanced input, 1k-ohm input termination
    • Ultralinear: wideband 1.68mV, -64.5dBW; A weighted 0.345mV, -78.30dBW.
    • Triode: wideband 3.02mV, -59.4dBW; A weighted 0.626mV, -73.1dBW.
  • AC line current draw at idle: 0.8A.
  • Output impedance at 50Hz
    • Ultralinear: 1.4 ohms.
    • Triode: 3.0 ohms.
  • This amplifier does not invert polarity.

Measurements Summary

Power output with 1kHz test signal
  • 8-ohm load at 1% THD (ultralinear): 30W
  • 8-ohm load at 1% THD (triode): 12W
  • 8-ohm load at 10% THD (ultralinear): 38W
  • 8-ohm load at 10% THD (triode): 23W

  • 4-ohm load at 1% THD (ultralinear): 25W
  • 4-ohm load at 1% THD (triode): 8W
  • 4-ohm load at 10% THD (ultralinear): 40W
  • 4-ohm load at 10% THD (triode): 25W
General
The Manley Mahi is a low-to-medium-power tube amplifier utilizing two pairs of EL84 output tubes operated in push-pull parallel. The design is quite flexible as it has two toggle switches that change the output-tube operating mode from ultralinear to triode, and change the amount of negative feedback in three steps. Rated power is 40W in ultralinear mode and 20W in triode mode.
Because there are really six combinations of output-stage mode and amount of feedback, I am going to give characteristics for two extremes: ultralinear with maximum feedback and triode with minimum feedback.
Chart 1A shows the frequency response of the amp in ultralinear mode with varying loads. As can be seen, the output impedance, as judged by the closeness of spacing between the curves of open circuit, 8-ohm, and 4-ohm loading, is of a relatively low value for a tube amplifier. The variation with the NHT dummy load in the audio range is of the order of +/-1dB. Chart 1B illustrates the frequency response in triode mode with minimum feedback. Here it can be seen that the spacing of the curves is much greater with consequent lower damping factor. Further, the-above-the-audio-range peaking of the ultralinear output is absent in the triode output. Not shown is the fact that the relative curve spacing is about the same for ultralinear and triode for the three different amounts of feedback.
Chart 2A shows how total harmonic distortion plus noise vs. power varies for 1kHz and SMPTE IM test signals and amplifier output load. In ultralinear, the attainable power is about the same for 4- and 8-ohm loads. In chart 2B, the attainable power is slightly higher for the 4-ohm load.
Total harmonic distortion plus noise as a function of frequency at several different power levels is plotted in chart 3A for ultralinear mode. Amount of rise in distortion at low and high frequencies is reasonable and typical for a tube power amplifier. In chart 3B for triode, the amount of distortion is generally similar to that of the ultralinear output except the amount of rise at high frequencies is a bit greater.
Damping factor vs. frequency is shown in chart 4A and 4B for ultralinear and triode, respectively.
A spectrum of the harmonic distortion and noise residue of a 10W 1kHz test signal is plotted in chart 5A and chart 5B for ultralinear and triode modes. The magnitude of the AC-line harmonics is typical for many amplifiers, and intermodulation components of line harmonics with signal harmonics are also visible around the nulled-out fundamental signal frequency and the lower harmonics. The signal-harmonic spectrum tails off reasonably rapidly.

Chart 1 - Frequency Response of Output Voltage as a Function of Output Loading

Ultralinear - Maximum Feedback

Red line: open circuit
Magenta line: 8-ohm load
Blue line: 4-ohm load
Cyan line: NHT dummy-speaker load

Triode - Minimum Feedback

Red line: open circuit
Magenta line: 8-ohm load
Blue line: 4-ohm load
Cyan line: NHT dummy-speaker load

Chart 2 - Distortion as a Function of Power Output and Output Loading

Ultralinear - Maximum Feedback

(line up at 10W to determine lines)
Top line: 4-ohm SMPTE IM
Second line: 8-ohm SMPTE IM
Third line: 4-ohm THD+N
Bottom line: 8-ohm THD+N

Triode - Minimum Feedback

(line up at 1W to determine lines)
Top line: 4-ohm SMPTE IM
Second line: 8-ohm SMPTE IM
Third line: 4-ohm THD+N
Bottom line: 8-ohm THD+N

Chart 3 - Distortion as a Function of Power Output and Frequency

Ultralinear - Maximum Feedback

4-ohm output loading
Cyan line: 30W
Blue line: 20W
Magenta line: 5W
Red line: 1W

Triode - Minimum Feedback

4-ohm output loading
Cyan line: 15W
Blue line: 10W
Magenta line: 5W
Red line: 1W

Chart 4 - Damping Factor as a Function of Frequency

Ultralinear - Maximum Feedback

Damping factor = output impedance divided into 8

Triode - Minimum Feedback

Damping factor = output impedance divided into 8

Chart 5 - Distortion and Noise Spectrum

Ultralinear - Maximum Feedback

1kHz signal at 10W into an 8-ohm load

Triode - Minimum Feedback

1kHz signal at 10W into an 8-ohm load

附加数据

  • 测量是用120V交流线路电压和一个通道驱动(这是一个单声道放大器)。
  • 增益
    • 超线性:28.9x,29.5分贝。
    • 三极管:52.3x,三十四点四分贝。
  • 输出噪声,8欧姆负载,不平衡输入,1K的欧姆的输入端接
    • 超线性:宽带1.68mV,- 64.5dBW,一个加权0.345mV,- 78.30dBW。
    • 三极管:宽带3.02mV,- 59.4dBW,一个加权0.626mV,- 73.1dBW。
  • AC线在空闲电流消耗:0.8A。
  • 在50Hz输出阻抗
    • 超线性:1.4欧姆。
    • 三极管:3.0欧姆。
  • 该放大器的极性不能倒置。

测量综述

功率输出1kHz的测试信号
  • 8欧姆负载1%总谐波失真(超线性)功率:30W
  • 8欧姆负载1%总谐波失真(三极管):12瓦
  • 8欧姆负载为10%总谐波失真(超线性):38W
  • 8欧姆负载为10%总谐波失真(三极管):23W

  • 4欧姆负载1%总谐波失真(超线性)功率:25W
  • 4欧姆负载1%总谐波失真(三极管):为8W
  • 4欧姆负载为10%总谐波失真(超线性)功率:40W
  • 4欧姆负载为10%总谐波失真(三极管)功率:25W
一般
马希的曼利是低到中等功率管放大器,利用两个EL84输出工作在推挽式并联管双。 该设计非常灵活,因为它有两个拨动开关,改变超线性输出管经营模式三极管,并更改三个步骤负反馈量。 额定功率是在超线性模式和三极管模式20W的功率40W。
因为真的有六个输出级模式和反馈量的组合,我要给两个极端的特点:最大的反馈和最小的超线性反馈三极管。
图1A显示了在不同负载模式下的超线性放大器的频率响应。 可以看出,输出阻抗,作为判断之间开路,8欧姆,4欧姆负荷曲线间距接近,一个为一管放大器相对较低的价值。 与音频范围内的莱科萨斯假负载的变化,是秩序+ / - 1dB的。 图1b显示了以最小的反馈三极管模式下的频率响应。 这里可以看出,曲线间距大大降低阻尼系数与随之而来的更大。 此外,-以上的音频范围的超线性输出峰值是在三极管输出缺席。 未显示的是相对曲线间距大约为超线性相同,为三个不同数量的反馈三极管的。
图2a显示了总谐波失真加噪声与功率为1kHz的测试信号和SMPTE的IM和放大器的输出负载变化。 在超线性,在达到相同的功率约为4 - 和8欧姆的负载。 在图2b中,实现权力稍有4欧姆负载较高。
总谐波失真加作为频率的函数噪声功率水平在几个不同的是在图3a密谋超线性模式。 崛起中的低失真和高频率的数额是合理的和管功率放大器的典型。 在图3b为三极管,失真的数额大致相同的项目,除了在高频率的增加额超线性输出,是一个大一些。
阻尼随频率变化的因素是显示在图4a和三极管和超线性4B条,分别为。
阿的谐波失真和10W的1kHz的测试信号噪声残留在频谱图5a和图5b密谋超线性和三极管模式。 将AC -线路谐波幅度是许多放大器的典型,以及与线路谐波互调信号的谐波成分是围绕清零时根本信号频率和较低的谐波可见。 信号谐波频谱尾巴了合理的迅速发展。
TOP
30#

Monarchy Audio SE-160 Mono Amplifiers

Additional Data

  • Measurements were made with 120V AC line voltage.
  • Power output and distortion plotted with one channel driven (this is a mono amplifier).
  • Gain: 11.3x, 21.1dB.
  • Output noise, 8-ohm load, unbalanced input, 1k-ohm input termination: wideband 0.536mV, -74.5dBW; A weighted 0.185mV, -83.7dBW.
  • AC line current draw at idle: 1.47A.
  • Output impedance at 50Hz: 0.3 ohms.
  • This amplifier inverts polarity.

Measurements Summary

Power output with 1kHz test signal
  • 8-ohm load at 1% THD: 40W
  • 8-ohm load at 10% THD: 230W

  • 4-ohm load at 1% THD: 72W
  • 4-ohm load at 10% THD: 470W
General
The Monarchy Audio SE-160 is an interesting attempt to duplicate some of the characteristics of a single-ended (SE) tube amplifier in a hybrid solid-state design. What is very SE-tube-like is the amount and way the distortion rises with power output, with the second harmonic being dominant. This distortion characteristic, no doubt, is generated in the vacuum-tube front end of this design. What is different from most tube SE amplifiers is the wide bandwidth and low out impedance of the SE-160.
Chart 1 shows the frequency response of the amp with varying loads. As can be seen in the chart, the high-frequency bandwidth is about 100kHz and is nicely controlled in shape as a function of loading. In the case of the NHT dummy load, the variation is about a harmless +/-0.25dB. Chart 2 illustrates how total harmonic distortion plus noise versus power varies for 1kHz and SMPTE IM test signals and amplifier output load. As can be seen, attainable power is greater for the 4-ohm load, as is usual for most power amplifiers. Note the SE-tube-like smooth increase in distortion over the whole power range. Also note that the distortion is less for a 4-ohm load. Total harmonic distortion plus noise as a function of frequency at several different power levels is plotted in Chart 3. Admirable is the low increase in distortion at the higher frequencies. Damping factor versus frequency is shown in Chart 4. A spectrum of the harmonic distortion and noise residue is plotted in chart 5 for an 8-ohm load. The AC-line harmonic spectrum is composed of odd harmonics, and there are some modulation effects of the line frequency around the second harmonic of the signal test frequency of 1kHz. The signal frequency harmonic components fall off in a nice manner with the second harmonic most dominant. This is said to have desirable sonic consequences.

Chart 1 - Frequency Response of Output Voltage as a Function of Output Loading


Red line: open circuit
Magenta line: 8-ohm load
Blue line: 4-ohm load
Cyan line: NHT dummy-speaker load

Chart 2 - Distortion as a Function of Power Output and Output Loading


(line up at 5W to determine lines)
Top line: 8-ohm SMPTE IM
Second line: 4-ohm SMPTE IM
Third line: 8-ohm THD+N
Bottom line: 4-ohm THD+N

Chart 3 - Distortion as a Function of Power Output and Frequency


4-ohm output loading
Cyan line: 160W
Blue line: 75W
Magenta line: 10W
Red line: 1W

Chart 4 - Damping Factor as a Function of Frequency


Damping factor = output impedance divided into 8

Chart 5 - Distortion and Noise Spectrum


1kHz signal at 10W into an 8-ohm load

附加数据

  • 测量是用120V交流电压。
  • 输出功率和失真绘制一个驱动通道(这是一个单声道放大器)。
  • 增益:11.3x,21.1分贝。
  • 输出噪声,8欧姆负载,不平衡输入,1K的欧姆输入终端:宽带0.536mV,- 74.5dBW,一个加权0.185mV,- 83.7dBW。
  • 交流线电流消耗在空闲:1.47A。
  • 在50Hz输出阻抗:0.3欧姆。
  • 该放大器颠倒极性。

测量综述

功率输出1kHz的测试信号
  • 8欧姆负载,1%总谐波失真功率:40W
  • 8欧姆负载为10%总谐波失真:230W

  • 4欧姆负载,1%总谐波失真:72W
  • 4欧姆负载为10%总谐波失真:470W
一般
君主立宪制音频硒160是一个有趣的尝试重复混合固态设计的一个名额单(SE)的管放大器的一些特征。 什么是非常硒筒状的金额和方式的失真与输出功率的上升,与第二谐波被占主导地位。 这种失真的特点,无疑是产生这种设计真空管前端。 什么是大多数管放大器不同的是SE的宽带宽和的SE - 160低输出阻抗。
图1显示了用不同的负载放大器的频率响应。 由于可以在如图所示,高频带宽约为100kHz和控制是很好的形状作为一个加载功能。 在莱科萨斯假负载的情况下,变化是关于一个无害的+ / -0.25分贝。 图2说明了总谐波失真加噪声功率比和SMPTE即时1kHz的测试信号和放大器的输出负载变化。 可以看出,可实现功率为4欧姆负载更大,因为是常见的,最功率放大器。 请注意在变形硒筒状在整个功率范围内平稳增长。 还要注意,失真是一个4欧姆负载少。 总谐波失真加作为频率的函数噪声功率水平在几个不同的是在图3所示。 令人钦佩的是在较高的频率失真低增长。 阻尼频率因子与图4所示。 阿的谐波失真和噪声残留频谱图表5绘制一个8欧姆的负载。 在交流线路谐波频谱是由奇次谐波,而且都是围绕1kHz的测试频率的二次谐波信号频率的某些行调制效果。 该信号的频率谐波分量落在一个不错的方式出现的二次谐波最占主导地位。 据称,这是具有理想的声波的后果。
TOP
发新话题 回复该主题